

 Türkçe
Audiometry is a fundamental audiological test used to evaluate hearing functions. An audiogram is the graphical representation of the results of this test. The type and degree of hearing loss and the frequencies at which it occurs can be determined in detail through an audiogram.
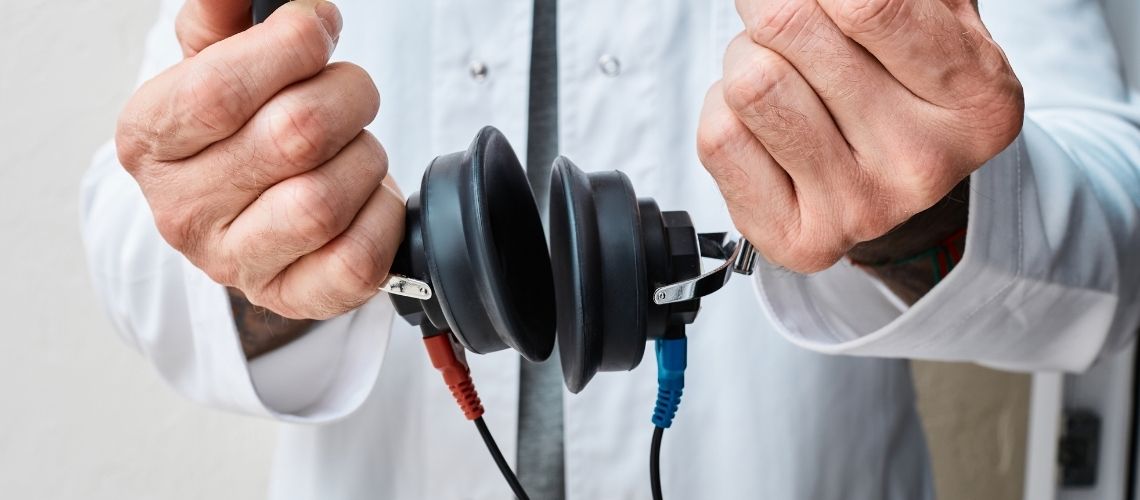
Audiometry tests are generally performed in a quiet room using special headphones. The patient’s responses to sounds presented at different frequencies are recorded. In this way, both air conduction and bone conduction hearing thresholds are measured, and a detailed evaluation is performed.
An audiogram is important in distinguishing whether hearing loss is sensorineural or conductive. It also plays a guiding role in determining the patient’s need for a hearing aid and creating a treatment plan.
Audiometry tests are widely used in hearing screenings for children and for hearing complaints in adults. Hearing health can be protected and quality of life can be improved through regular checkups, early diagnosis, and appropriate treatment.
What Is an Audiogram and How Is It Structured?
An audiogram is a graph on which an individual’s minimum hearing sensitivity is marked according to frequency and intensity after their hearing ability has been measured with an audiometer. It has two main axes: the horizontal axis, which shows frequency, and the vertical axis, which represents sound intensity.
- Frequency (X-Axis) The frequency of sound is the physical property perceived by the ear and known psychoacoustically as “pitch.” Frequency is expressed in Hertz (Hz). Low-frequency sounds (bass sounds) are located on the left side of the graph, while high-frequency sounds (treble sounds), such as consonant sounds like “-s” and “-t,” are located on the right. This axis covers the human hearing range and particularly includes frequencies related to speech.
- Intensity (Y-Axis) The intensity of sound represents its loudness and is measured in decibels (dB). The upper part of the graph represents sounds of lower intensity, while sound intensity, or loudness, increases as the graph moves downward.
Various techniques are used when measuring individuals’ hearing sensitivity, and the techniques used and the results obtained are marked with various international symbols. These symbols indicate the hearing threshold. The most basic of these symbols are:
- O: Right ear air conduction test result
- X: Left ear air conduction test result
- <: Right ear bone conduction test result
- >: Left ear bone conduction test result
How Is an Audiogram Created?
An audiogram is a hearing test graph created by following specific steps. At the beginning of the test, the person sits in a soundproof room and is isolated from external noise. The person is then fitted with either calibrated, large-surface over-ear (supra-aural) headphones or insert earphones placed inside the ear, depending on which is appropriate. The patient’s air conduction and bone conduction hearing thresholds are determined, followed by speech tests. Pure tone audiometry is the test that forms the basis of the audiogram. At this stage, an audiometer is used to generate pure tones at various frequencies between 250 Hz and 8000 Hz. These sounds are presented at different intensity levels (dB—decibels), and the person gives a signal whenever they hear a sound. The audiologist gradually increases or decreases the sound to determine the person’s hearing threshold at each frequency.
A bone conduction test is also generally performed together with the air conduction test. A small oscillator is placed on the mastoid bone behind the ear, and sound is transmitted to the inner ear using this method. This test is performed to determine the type of hearing loss.
Finally, the test results are recorded on the audiogram. On this graph, frequencies are shown on the x-axis, while sound intensity is shown on the y-axis. The degree of hearing loss is evaluated by the audiologist according to the identified thresholds.
What Does an Audiogram Show About Your Hearing Ability?
An audiogram provides the opportunity to observe a person’s hearing ability in detail and allows the clinician to evaluate it quickly. First, hearing thresholds are assessed, and how well the person can hear sounds at different frequencies is determined. Normal hearing is considered to be between 0 and 20 dB HL, while values above this limit indicate hearing loss. Hearing loss may be very mild, mild, moderate, moderately severe, severe, or profound.
An audiogram also shows patterns of hearing loss. For example, people with prolonged exposure to loud noise experience noise-induced hearing loss, which is generally characterized by a “notch” around 4,000 Hz and higher frequencies. Age-related hearing loss generally begins symmetrically at high frequencies and progresses over time, also affecting the person’s ability to distinguish speech. In this type of hearing loss, low frequencies are preserved, while losses occur at higher frequencies.
Why Are Audiograms Important in Diagnosing Hearing Loss?
Audiograms not only help determine the type and degree of hearing loss but also form the basis for identifying the treatment method needed by the patient.
As a result of audiological examinations, the presence of hearing loss and its type, if any, are determined. For example, conductive hearing losses occur due to transmission problems originating from the outer or middle ear. These losses can generally be treated medically or surgically. Sensorineural losses, on the other hand, result from damage to the inner ear or auditory nerve and are generally permanent.
Audiograms show the degree of hearing loss and allow clinicians to determine appropriate treatment strategies. Hearing loss is divided into different levels of severity, and this severity is shown on the audiogram through hearing thresholds at various frequencies. In this way, personalized hearing aid settings can be made, or other intervention methods such as cochlear implants can be evaluated.
What Types of Hearing Loss Can an Audiogram Detect?
- Conductive Hearing Loss (CHL): This occurs when there are problems in transmitting sound to the inner ear due to conditions originating from the outer or middle ear. On the audiogram, bone conduction thresholds remain normal or close to normal, while a marked reduction is observed in air conduction thresholds. This type of hearing loss generally results from problems such as ear canal blockages, eardrum damage, or middle ear infections.
- Sensorineural Hearing Loss (SNHL): This results from damage to the inner ear or auditory nerve. The audiogram shows that both air conduction and bone conduction hearing are affected to an equal degree and that there is no significant difference between them. Although the affected frequency range varies depending on the existing pathology, presbycusis, ototoxicity, noise-induced hearing loss, and vestibular schwannoma are among the most commonly encountered conditions.
- Mixed Hearing Loss: This is a condition in which both conductive and sensorineural hearing loss are present together. This condition indicates both transmission problems in the middle ear and damage related to the inner ear or auditory nerve.
How Are Audiogram Results Read?
Audiogram results are interpreted according to hearing thresholds at specific frequencies and intensity levels. First, the x-axis shows frequency in Hertz (Hz). The y-axis represents hearing level in decibels (dB). By measuring hearing thresholds, the degree and type of hearing loss can be determined. Hearing loss is classified as sensorineural, conductive, or mixed hearing loss.
The degrees of hearing loss are generally evaluated as follows:
- Normal hearing: Thresholds between 10 and 25 dB indicate normal hearing ability.
- Very Mild Hearing Loss: Thresholds are between 26 and 34 dB. The individual’s ability to distinguish speech is not greatly affected.
- Mild hearing loss: Thresholds are between 35 and 40 dB, and the person has difficulty hearing sounds such as soft whispers.
- Moderate hearing loss: Hearing thresholds are between 41 and 55 dB. Therefore, ordinary conversation is difficult to hear. Understanding speech becomes even more difficult in noisy environments.
- Moderately Severe Hearing Loss: Thresholds are between 56 and 70 dB, and high-intensity sounds can be heard comfortably. The person’s ability to distinguish speech is seriously affected. The use of a hearing aid may be required depending on the condition.
- Severe Hearing Loss: This is hearing loss between 71 and 90 dB. Without a hearing aid, the patient’s quality of life is seriously affected.
- Profound Hearing Loss: This is hearing loss of 91 dB or above. Alternative methods such as hearing aids or even cochlear implants may be required.
What Is the ‘Speech Banana’ on an Audiogram?
The speech banana refers to a specific range of frequencies and intensities on an audiogram where the sounds that make up human speech are located. This area lies between 250 Hz and 6,000 Hz and has an intensity of approximately 20 to 60 dB. Its shape resembles a banana, which is why it is called the “speech banana.”
The sounds within this area include the frequencies and intensities of both vowel and consonant sounds. Vowel sounds are generally located at lower frequencies and can be heard more easily. In contrast, consonant sounds are located at higher frequencies, making them more difficult to hear for individuals with hearing loss in this region.
These consonant sounds are among the first sounds affected, particularly in people with sensorineural hearing loss. This makes it difficult for people with hearing loss to distinguish words clearly. For this reason, understanding speech becomes even more difficult, especially in noisy environments.
Hearing loss impairs speech intelligibility, and even if vowels are heard, speech becomes unclear because consonants are lost. Audiologists evaluate this condition and optimize the performance of hearing aids. They recommend appropriate amplification solutions, especially to ensure that the sounds within the speech banana can be heard correctly.
How Long Does It Take to Complete an Audiogram?
An audiogram test is generally completed within 20 to 30 minutes. However, the duration of the test may be longer or shorter depending on certain factors. Factors affecting the test duration include:
- The complexity of the hearing loss
- The patient’s age and level of cooperation during the test
- Whether a detailed evaluation is required
A standard audiometry test is performed in a soundproof room. The primary measurement is pure tone audiometry. This method is used to determine the lowest sound level that a person can hear at different frequencies. Both air conduction and bone conduction are used during the test. Headphones are used for air conduction, while a small vibrator placed on the skull is used for bone conduction.
The test conditions require the patient to identify the pure tones presented through headphones. In addition, speech audiometry should also be performed on every patient. In this way, the audiometry test is confirmed, and a projection regarding possible other pathologies can be created. Speech audiometry tests evaluate the patient’s ability to hear and repeat words.
In addition, pure tone audiometry is part of a broader group of hearing tests. Therefore, different tests may be added when needed, apart from the standard test battery. For this reason, the appointment duration may be extended.
When Should You Have a Hearing Test?
The circumstances in which a hearing test is required are highly important for your hearing health. Hearing loss may occur gradually or suddenly, and when this is noticed, an audiologist should be consulted without delay. In particular, difficulty following conversations in noisy environments and an inability to hear high-frequency sounds may indicate hearing loss.
Because the inner ear is the center of both hearing and balance, dizziness and balance problems are also among the conditions that require a hearing test. Such problems may be symptoms of diseases originating from the inner ear, and a hearing test is an important step toward an accurate diagnosis.
Tinnitus, meaning continuous ringing in the ears, may be an indicator of hearing damage. If you have experienced tinnitus for a long time, a hearing test may be necessary to evaluate whether there is permanent damage to your hearing.
How Are Audiograms Used to Adjust Hearing Aids?
Audiograms allow hearing aids to be adjusted precisely according to the needs of patients. Audiologists use audiogram results to determine the frequencies at which hearing loss is most pronounced. Accordingly, the hearing aid is individually programmed to provide appropriate amplification for high or low frequencies. This allows the patient to hear more clearly at frequencies where they experience difficulty.
Audiograms also play a critical role in correctly setting gain and compression. Depending on the degree of hearing loss, it is determined how soft or loud sounds will be transmitted through the hearing aid. The basic considerations for gain and compression settings are listed below:
- Low gain is applied for low-frequency sounds.
- If hearing loss is present at high frequencies, higher gain is provided for these frequencies.
- Compression settings prevent loud sounds from becoming uncomfortable. In this way, the person can better tolerate and distinguish surrounding sounds.
Audiologists use audiograms to determine the prescription formulas most appropriate for the patient’s hearing loss. These formulas, based on scientific principles such as NAL-NL2 or DSL, allow the hearing aid to be adjusted precisely at different frequencies.
Frequently Asked Questions
Audiometry is the general name for tests that evaluate hearing levels. An audiogram is the result document in which these tests are displayed graphically. These two complementary concepts are used in the diagnosis and follow-up of hearing loss.
Audiometry testing is requested in many situations, including hearing loss, tinnitus, dizziness, noise exposure, sudden changes in hearing, and hearing aid evaluation. The results are evaluated in detail on an audiogram.
During the test, the person wears headphones in a soundproof booth and responds to sounds presented at different frequencies and intensities. Bone conduction measurements are also performed when necessary. The test is painless and is generally completed in a short time.
An audiogram shows hearing thresholds at different frequencies on a graph. The degree and type of hearing loss and the frequencies it affects are evaluated using this graph, allowing an appropriate treatment and follow-up plan to be created.
Audiometry makes it possible to distinguish between conductive, sensorineural, and mixed hearing loss. This distinction is important for the ear, nose, and throat specialist and audiologist to make a diagnosis and determine an appropriate treatment or rehabilitation plan.
Yes. Hearing assessments can be performed in every age group, from infants to adults, using audiological testing methods appropriate to the child’s age and developmental level. Early diagnosis is highly important for language and speech development.
Hearing aid selection is planned according to the type and degree of hearing loss shown on the audiogram. Through accurate analysis, a device suited to the person’s hearing needs can be selected, and its settings can be optimized individually.
Special preparation is generally not required. However, if there is excessive earwax, an active infection, or pain in the ear, these conditions should be evaluated first. Being well-rested on the day of the test and following the instructions helps produce more reliable results.
Follow-up intervals for people with hearing loss vary according to age, disease, and treatment. People who work in noisy environments, use hearing aids, or have progressive hearing loss should undergo regular audiological evaluations.
An audiologist should be consulted if there is reduced hearing, tinnitus, difficulty understanding speech, dizziness, or a history of exposure to loud noise. Early audiological evaluation may help prevent the progression of hearing loss.

Dr. Audiologist Emel Uğur was born in 1982 in Çanakkale. She specialized in Pediatric Audiology, Otologic Disorders, and Vestibular System Disorders, and served for 15 years at the Istanbul Training and Research Hospital. In 2015, she joined the Acıbadem Healthcare Group. She currently works as an Audiologist at the Acıbadem Altunizade Hospital and also serves as a faculty member and program director in the Acıbadem University Vocational School of Health Services Audiometry Program.










Location of our clinic in Istanbul, Turkey